Back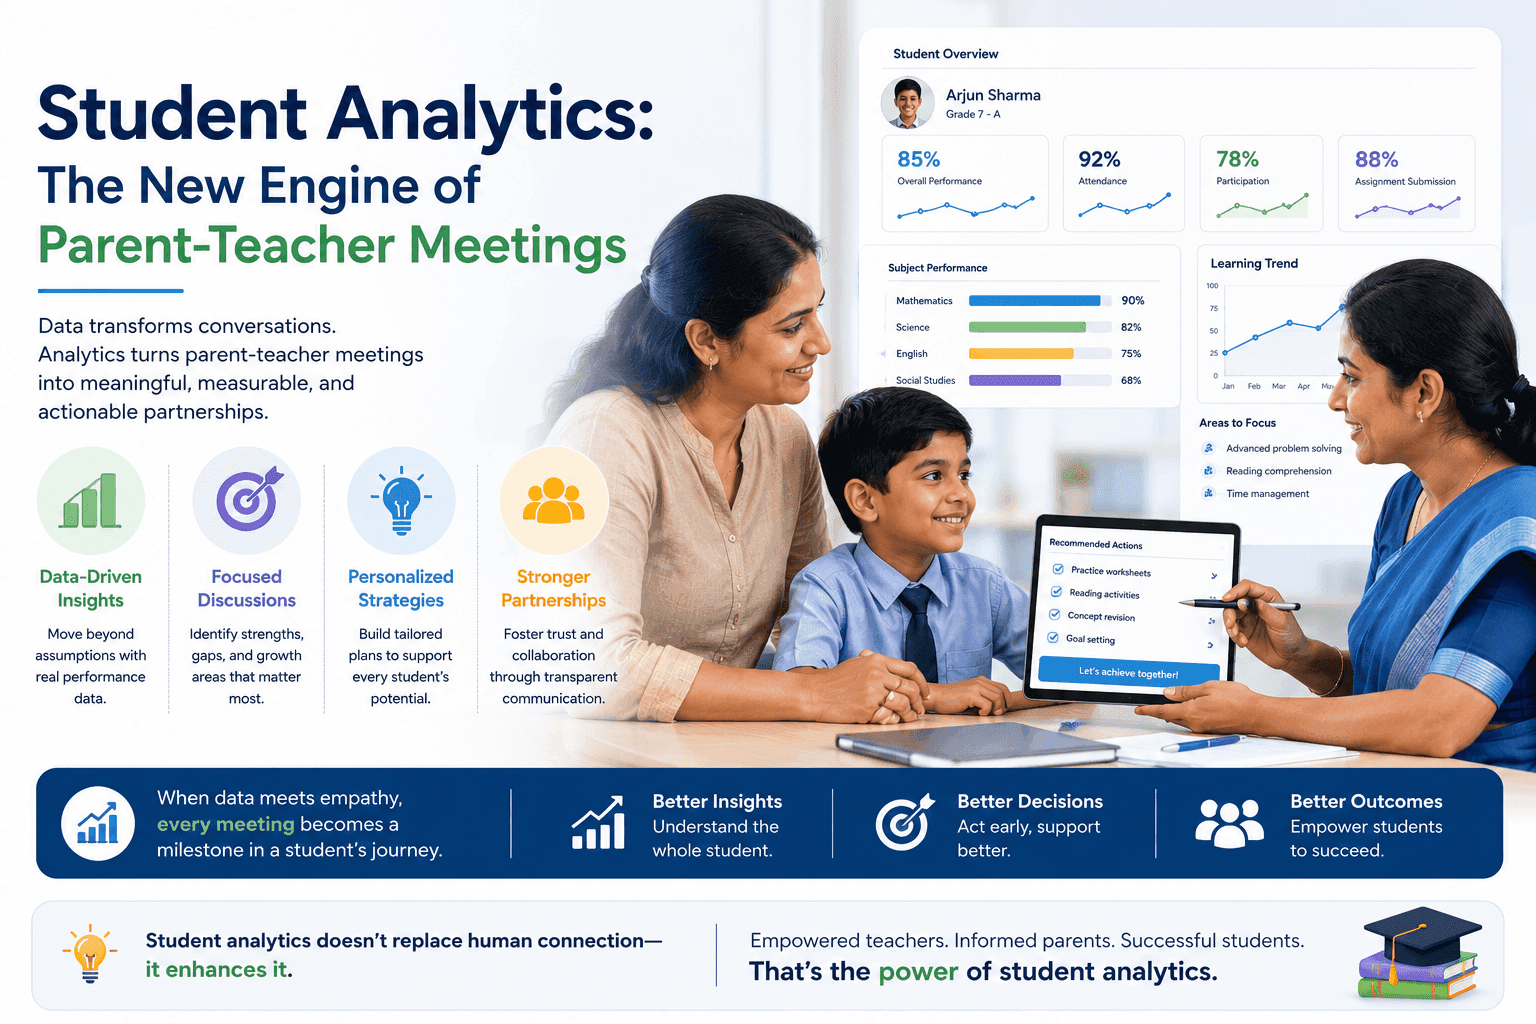
Student Analytics: The New Engine of Parent-Teacher Meetings
29th June 2026 · 5 min read
Parent-teacher meetings are changing. When both sides arrive with data, conversations shift from reporting to problem-solving. Here's how student analytics make that possible.
The traditional parent-teacher meeting follows a familiar script. The teacher reads from memory or a handwritten record. The parent listens, occasionally surprised, occasionally defensive. A few generic recommendations are made. Everyone leaves with good intentions that are mostly forgotten by the time the next term begins.
This format is not a failure of effort. It is a failure of information. Teachers carry too many students' data in their heads to discuss any one student in meaningful depth. Parents arrive without context for what they are hearing. The meeting becomes a report card recitation rather than a productive conversation.
Student analytics platforms are changing this — not by replacing the human relationship at the center of parent-teacher meetings, but by arming both sides with the data they need to have a better one.
What Student Analytics Actually Provide
A student analytics module aggregates a student's performance data across multiple dimensions:
- Assessment scores over time, by subject and topic
- Attendance patterns, including frequency and timing of absences
- Assignment completion rates
- Areas of consistent strength and consistent weakness
- Comparative performance within the class (in aggregate, not by naming peers)
- Historical trajectory — whether performance is improving, declining, or stable
This is not new data. Teachers have always had access to all of this information. What analytics do is organize and surface it in a way that makes patterns visible that would otherwise require significant manual analysis to see.
How This Changes the Meeting
When a teacher can pull up a student's analytics view before a meeting, preparation that used to take 20 minutes per student takes two. More importantly, the analysis is more complete - no data point is forgotten because it was stored in a different register.
When parents can see the same view before they arrive - or are shown it at the start of the meeting - the conversation begins from a shared understanding. There is less time spent on "what do you mean by that?" and more time spent on "so what do we do about it?"
Specific, data-backed conversations also reduce the defensiveness that can arise in parent-teacher meetings. It is harder to dispute a four-week pattern in a performance graph than it is to dispute a teacher's anecdotal assessment.
The Weakness Analysis Use Case
Perhaps the most valuable application of student analytics is weakness identification — pinpointing not just that a student is performing below expectation in mathematics, but specifically which topics or question types are generating the most errors.
A student who struggles with geometry but excels at algebra needs different support than a student who struggles with both. Without granular analytics, this distinction is hard to make in a timely way. With it, teachers can make targeted recommendations and parents can provide targeted support at home.
What This Requires From Schools
Student analytics are only as good as the data that feeds them. For these insights to be meaningful, schools need:
- Consistent digital recording of assessment scores, not just final exam marks
- Regular homework and assignment tracking through a unified platform
- Complete attendance records without gaps or parallel paper systems
A school that records some assessments digitally and some on paper, or that marks attendance in the platform three days after the fact, will generate analytics that are incomplete and potentially misleading.
The investment in analytics is, therefore, partly an investment in data discipline — and the schools that have built that discipline consistently report that it improves their operational quality far beyond the analytics use case.
The Parent Engagement Multiplier
There is a secondary benefit to student analytics that does not appear in product feature lists: parents who feel genuinely informed about their child's progress engage more with the school.
When a parent can check their child's weekly performance summary on their phone rather than waiting for a term-end report card, they feel like a partner in their child's education rather than a passive recipient of results. That feeling drives attendance at school events, responsiveness to teacher communications, and cooperation during difficult conversations.
Student analytics, done right, are not just a reporting tool. They are a trust-building mechanism between schools and the families they serve.
Vidh's student persona feature provides teachers and parents with a comprehensive view of academic performance, areas of weakness, historical progress, and attendance - designed to make every parent-teacher meeting a productive one.